
The U.S. housing market has experienced significant shifts over the past two decades, from the early 2000s housing boom to the Great Recession’s crash, followed by the recovery and record-breaking price surges during the COVID-19 pandemic. While some regions have seen wild price swings, others have remained relatively steady, offering homeowners a greater sense of stability over time. Understanding which markets have been the most stable can help homebuyers, investors, and policymakers anticipate risks and make informed decisions.
To assess long-term housing market stability, researchers at Construction Coverage—a website that provides construction insurance guides—analyzed home price trends across states and major U.S. metro areas using Zillow data from 2000 to present. Markets were ranked based on the likelihood that a random buyer would have experienced a price drop of more than 5% following their purchase. This approach identifies regions that have historically been less prone to volatility, offering insight into where home values have remained more resilient through economic cycles.
Here are some key insights from the analysis:
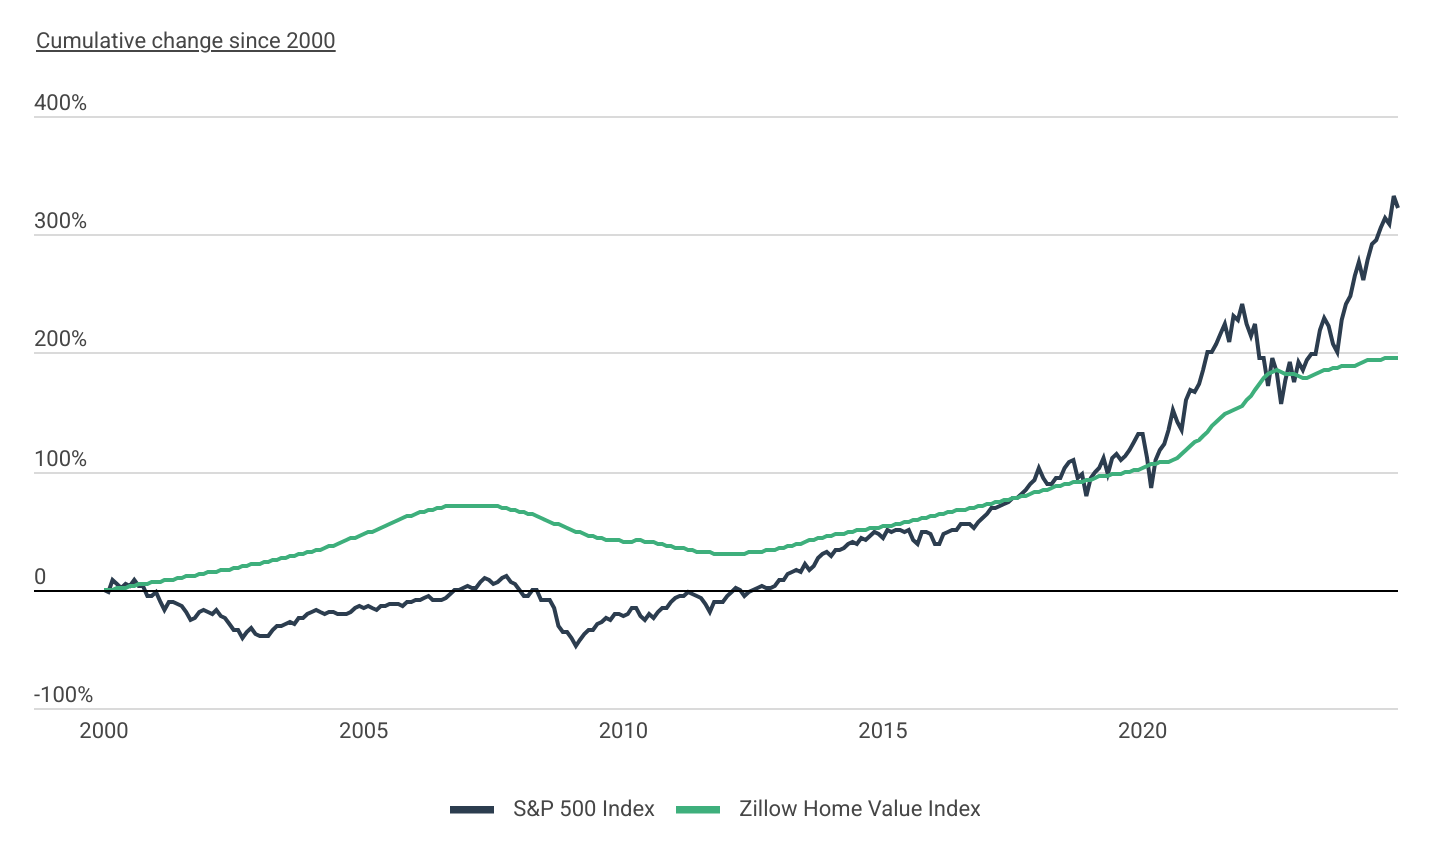
- Housing vs. Stock Market: The U.S. housing market has offered more stability than the stock market over the past 25 years. But while home prices have been less volatile, long-term gains have been lower (+196% for the Zillow Home Value Index vs. +322% for the S&P 500 Index).
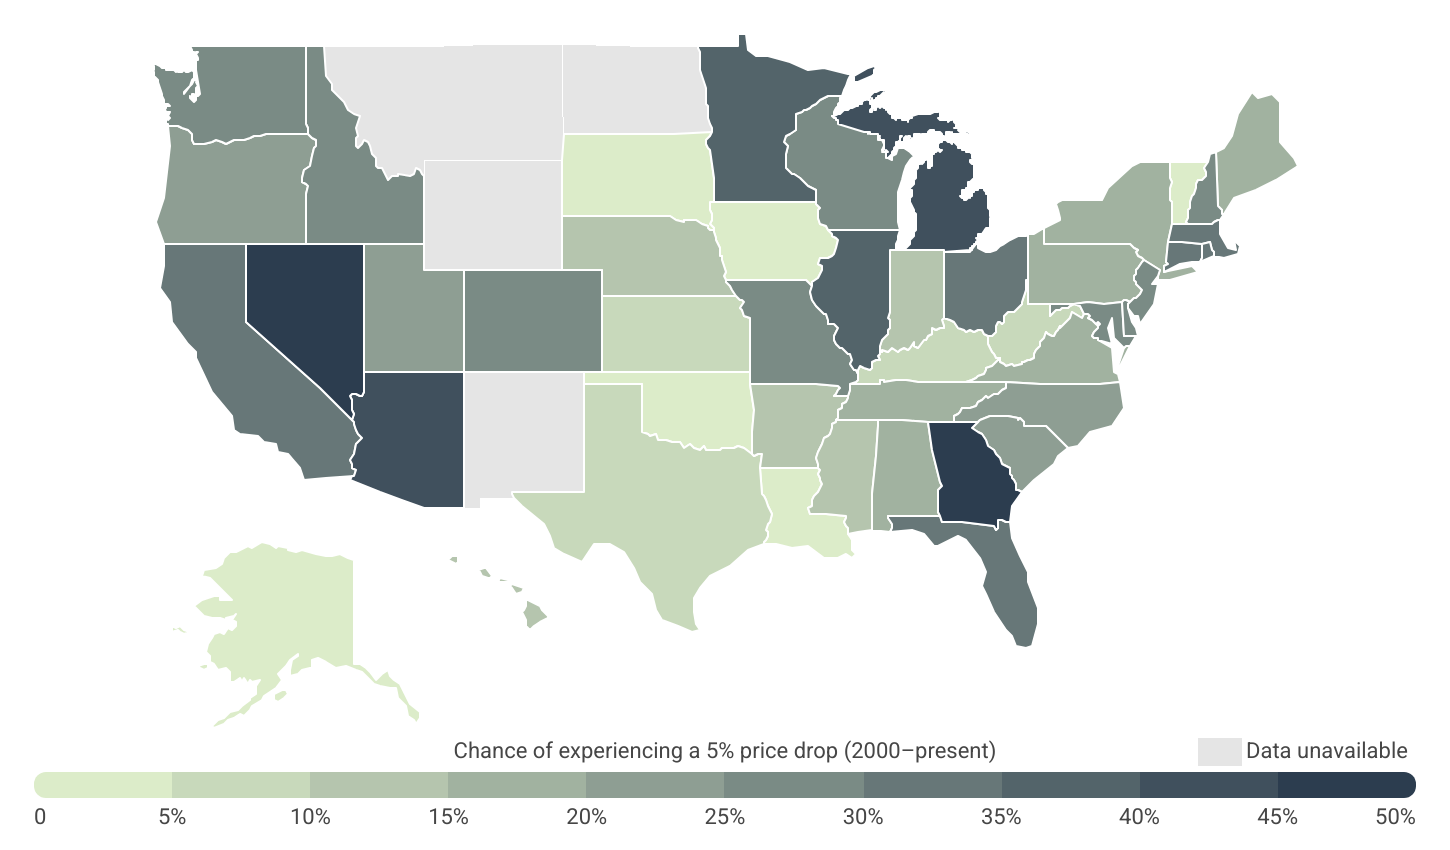
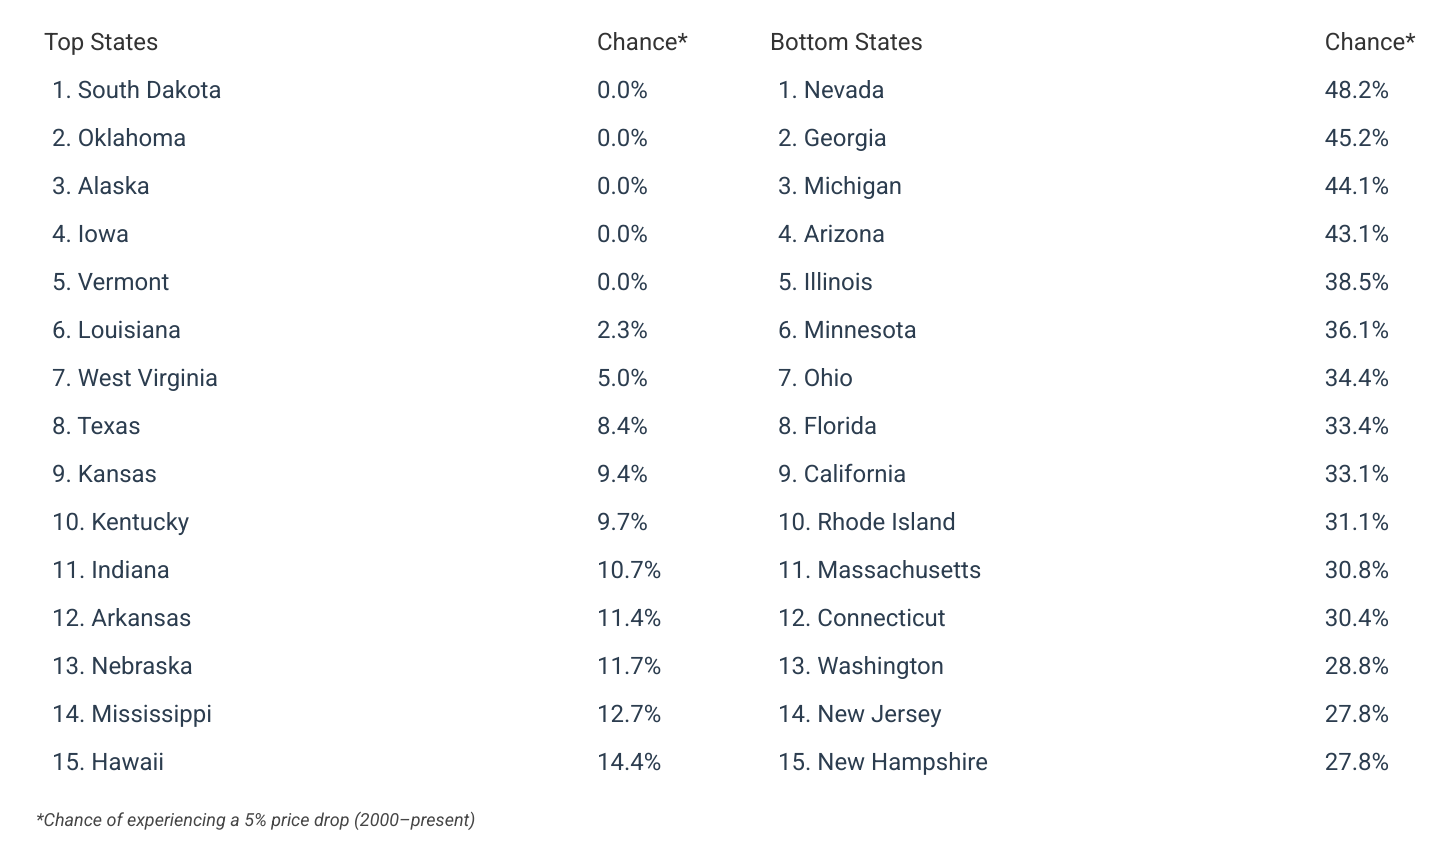
- State-Level Stability: Home price stability varies dramatically by location. Five states—South Dakota, Oklahoma, Alaska, Iowa, and Vermont—never saw median home prices drop by more than 5% at any point over the past 25 years.
- Most Volatile States: In four states, a random buyer had at least a 40% probability of experiencing a price decline greater than 5% at some point.
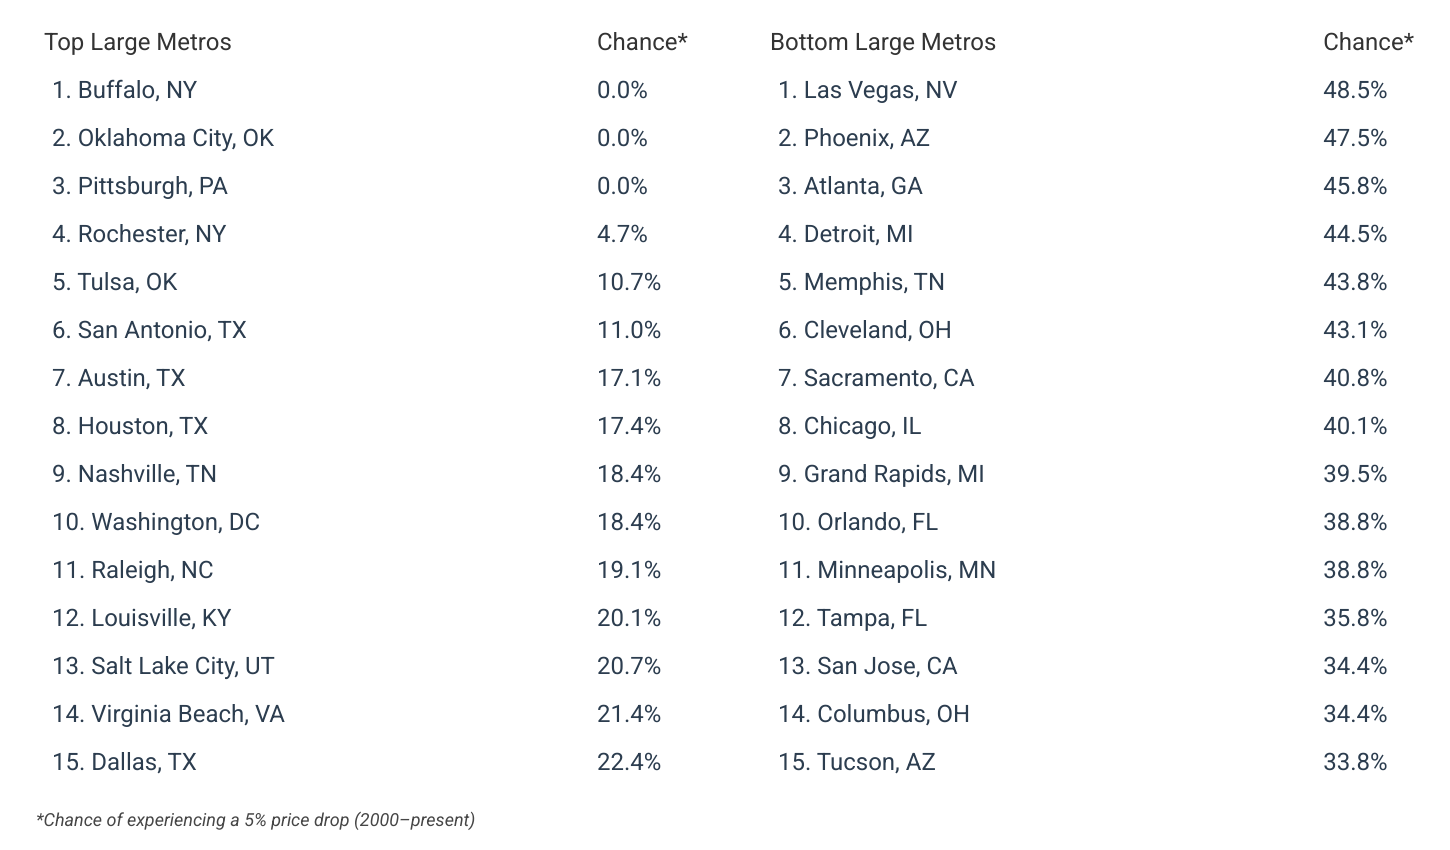
- Most Stable Large Metros: Among major metros with populations over one million, three markets—Buffalo, NY; Oklahoma City, OK; and Pittsburgh, PA—offered homebuyers a zero probability of experiencing a 5% or greater price drop in the past 25 years.
- Least Stable Large Metros: In contrast, eight major metros had a greater than 40% probability of a 5% or more price drop, with Las Vegas ranking as the most volatile large housing market in the U.S.
U.S. Housing vs. Stock Market Stability
The housing market has offered more stability, but lower cumulative returns
Source: Construction Coverage analysis of Zillow data | Image Credit: Construction Coverage
Since 2000, the U.S. housing market has demonstrated significantly more stability compared to the stock market. According to the analysis, a random homebuyer since 2000 had just a 26.4% chance of experiencing a price drop greater than 5% at any point, whereas an investor in the S&P 500 Index had a 62.3% probability of facing the same decline. This highlights the relative resilience of home prices nationally, which tend to move more gradually and are less susceptible to short-term economic shocks compared to equities. While housing downturns can be severe—such as during the 2008 financial crisis—they occur less frequently and are often buffered by factors like local economic conditions and housing supply constraints.
However, while housing has been the safer investment in terms of volatility, the stock market has significantly outpaced home price appreciation. Since 2000, national home prices have risen by 196%, as measured by the Zillow Home Value Index (ZHVI), whereas the S&P 500 Index has grown by 322% over the same period. For those seeking a more stable—albeit less liquid—investment, real estate has been the better choice. However, for those prioritizing long-term growth, equities have historically offered greater returns.
That said, real estate is inherently a local investment. Most homebuyers purchase property in a single spot—meaning the stability of that specific market is far more important than national trends. Housing markets across the U.S. vary widely in their stability, with some experiencing only modest fluctuations while others undergo extreme booms and busts. The following section highlights these differences by examining Buffalo, NY—the most stable large metro—and Las Vegas, NV—the most volatile.
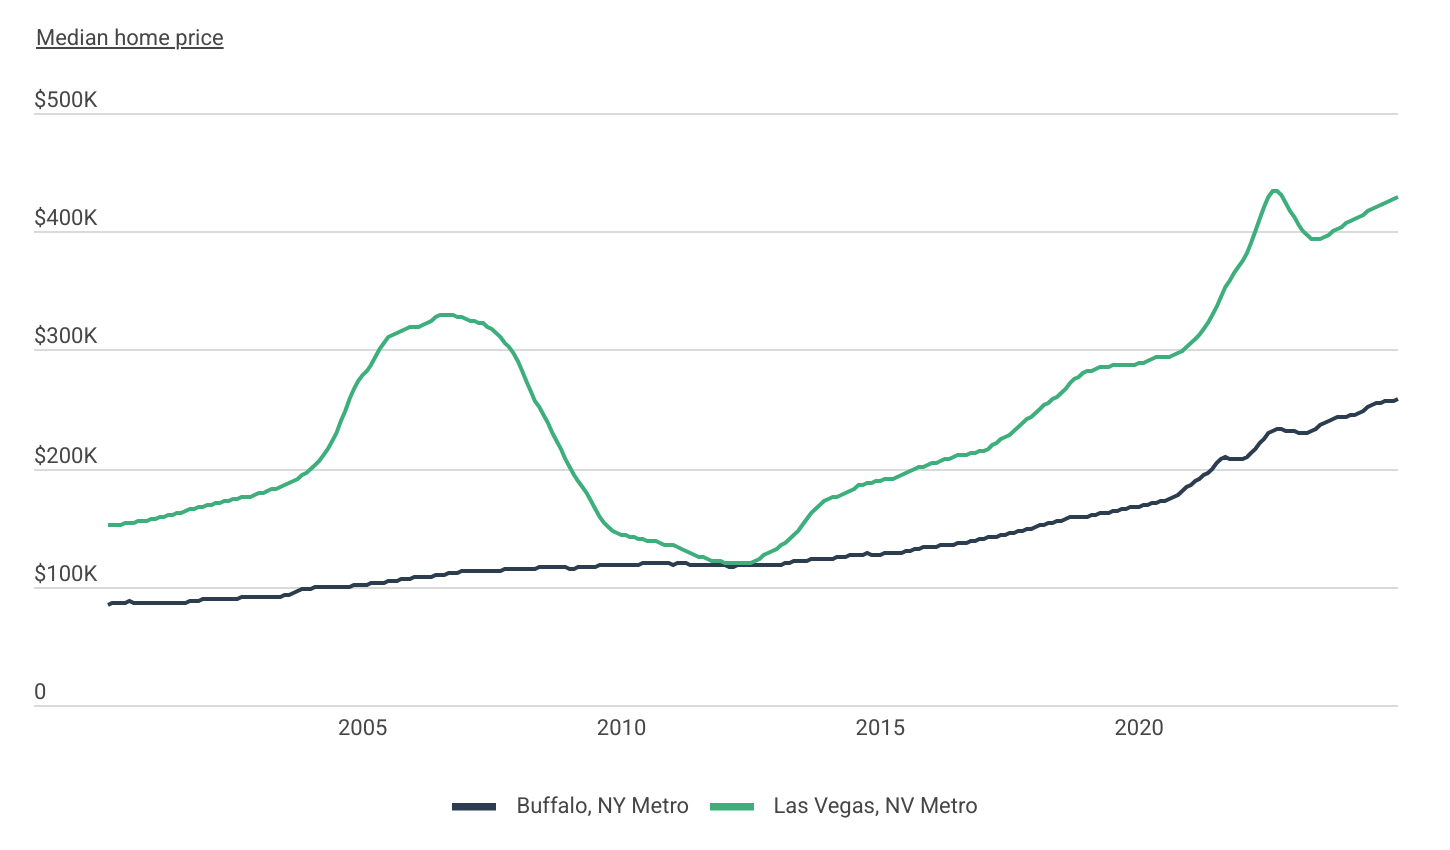
Two Market Extremes: Stability vs. High Volatility
Price volatility varies dramatically across different housing markets
Source: Construction Coverage analysis of Zillow data | Image Credit: Construction Coverage
The contrast between Buffalo, NY, and Las Vegas, NV highlights how housing markets can differ dramatically in their stability and susceptibility to price swings. Buffalo has been the most stable large metro in the U.S., with a 0% chance of a homebuyer experiencing a price drop greater than 5% since 2000. The area’s largest recorded decline was just 2.9% ($3,659), and home prices have steadily appreciated by 203% over the past 25 years, reaching a median price of $258,121 today. Buffalo’s stability is likely driven by slow but steady economic growth, lower housing demand volatility, and less speculative investing compared to other metros.
In stark contrast, Las Vegas has been the most volatile large metro, with a 48.5% probability of a 5% or greater price drop and a 63.9% peak-to-trough decline, amounting to a staggering $210,860 loss in home value. While home prices in Las Vegas have increased 182% since 2000, reaching a median value of $428,434, this growth has come with severe price fluctuations, particularly during the housing crash of 2008 and the rapid price corrections following the pandemic-era boom. The city’s high volatility can be attributed to speculative investment, a tourism-dependent economy, and a rapid influx of new housing supply, which amplifies both booms and busts.
Geographic Differences in Housing Market Stability
In 5 states, prices never dipped by more than 5% over the past 25 years
Source: Construction Coverage analysis of Zillow data | Image Credit: Construction Coverage
At the state level, five states—South Dakota, Oklahoma, Alaska, Iowa, and Vermont—have never seen median home prices decline by more than 5% over the past 25 years, demonstrating a level of resilience uncommon in the broader market. These states generally have lower population growth and steady local economies that shield them from extreme housing price swings. Among large metros, Buffalo, NY; Oklahoma City, OK; and Pittsburgh, PA stand out as the most stable, each with a 0% probability of a 5% or greater price drop since 2000. These cities, characterized by relatively affordable home prices and more steady demand, have been less impacted by housing bubbles and economic downturns.
In contrast, some states and metro areas have experienced significant volatility, driven by rapid population growth, investor-driven demand, and economic cycles tied to specific industries. Nevada, Arizona, and Florida rank among the least stable states, with home prices frequently rising and falling by large margins. In addition to Las Vegas, cities like Phoenix, AZ; Miami, FL; and Riverside, CA have all undergone dramatic price swings, fueled by real estate speculation, surging demand from out-of-state buyers, and waves of new construction. While these markets can generate high returns during housing booms, they also pose greater risks for homeowners and investors during economic downturns. Below is a breakdown of the top and bottom cities and states.
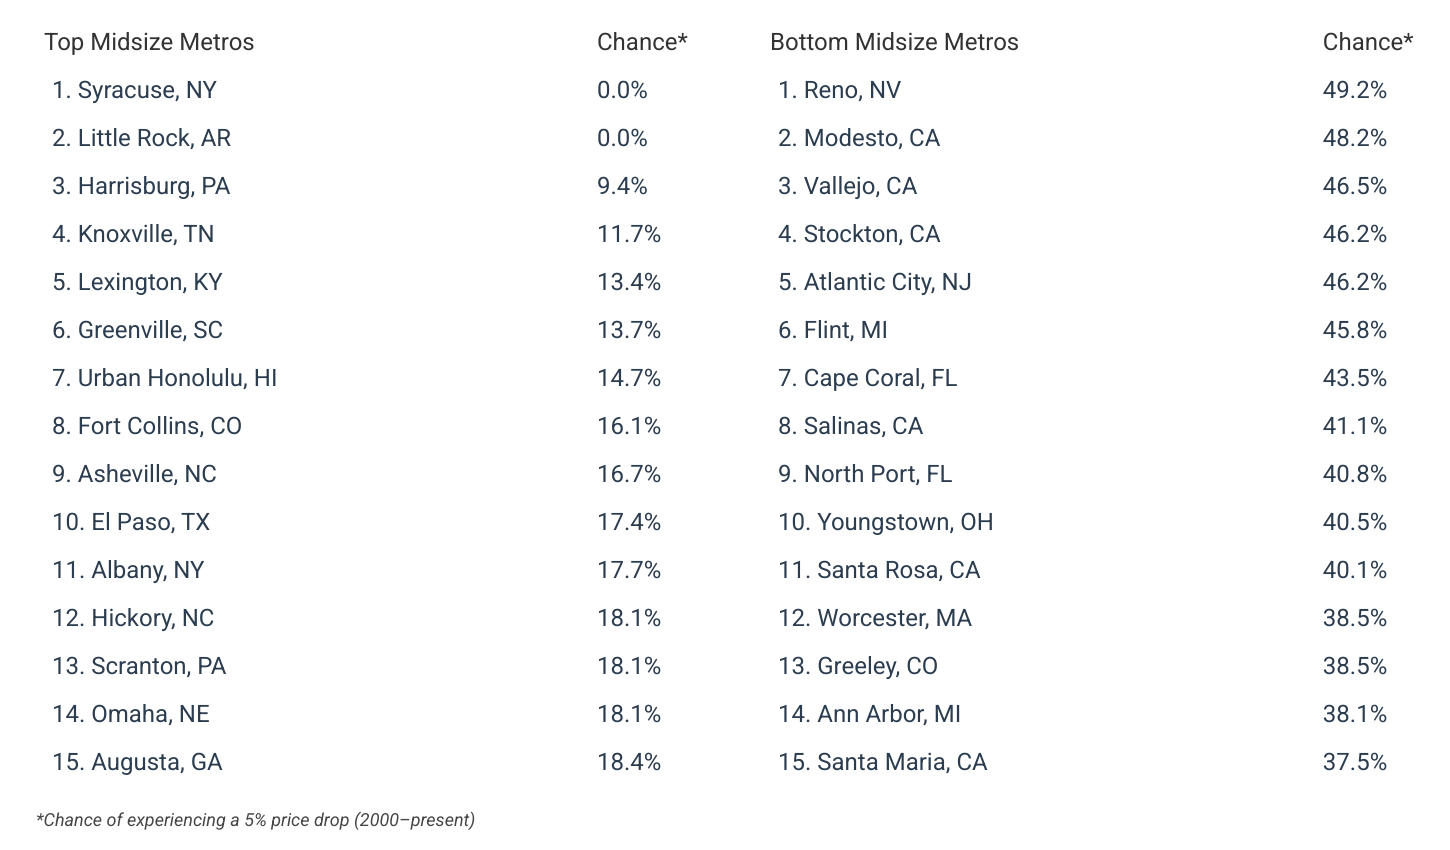
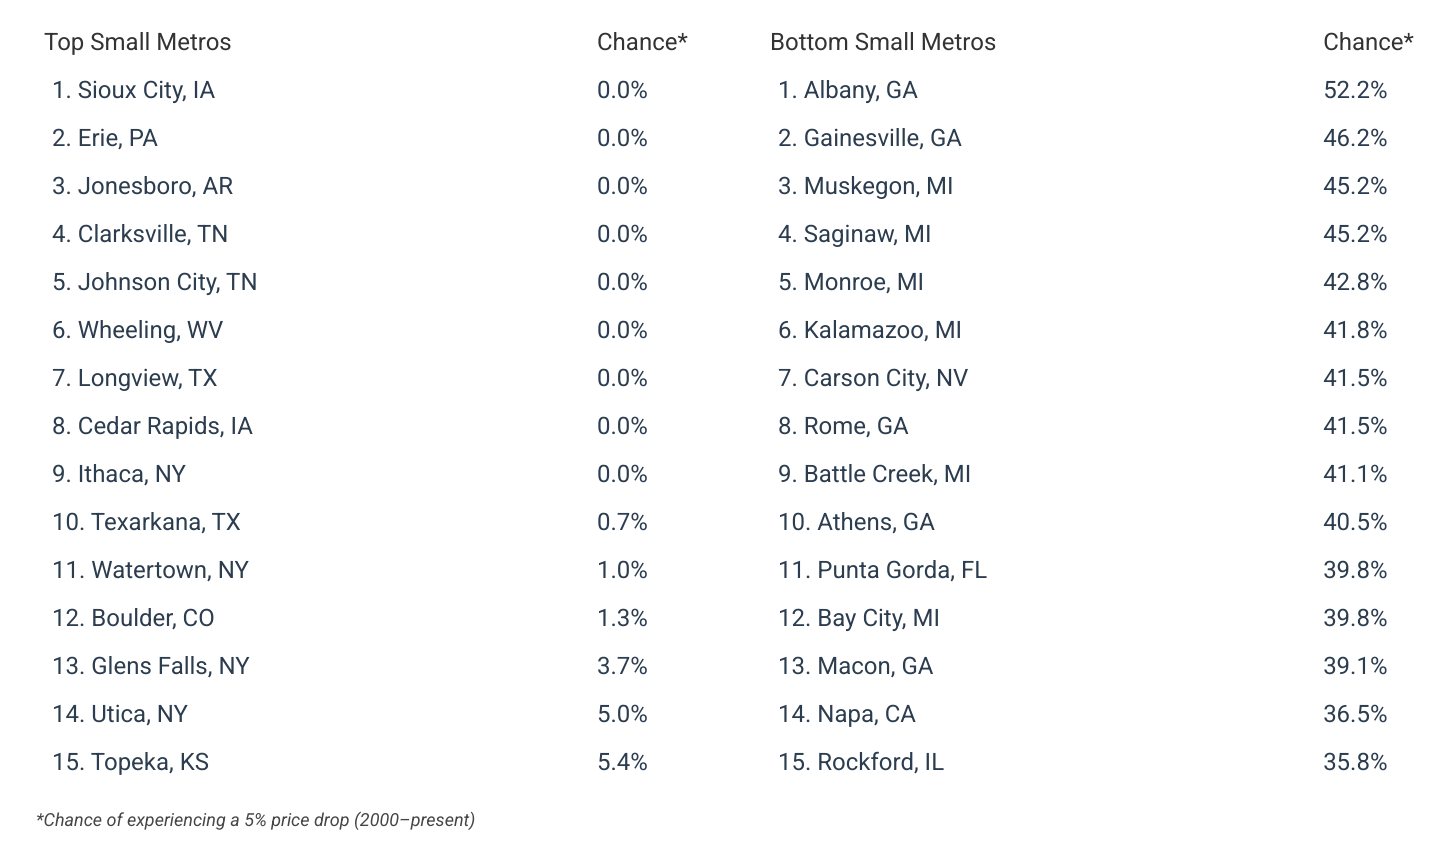
Cities With the Most & Least Stable Housing Markets
States With the Most & Least Stable Housing Markets
Methodology

Photo Credit: Robert Crum / Shutterstock
To determine the locations with the most stable housing markets, researchers at Construction Coverage analyzed the latest data from the Zillow Home Value Index (ZHVI), a measure of typical home value. The researchers ranked metros according to the probability that a random buyer purchasing a home at any point between 2000 and present would have experienced a greater-than-5% price drop following the purchase. In the event of a tie, the location with the lowest price drop from 2000 to present was ranked higher. Researchers also calculated the current median home price—using the most recent ZHVI—and the percentage change in home price from 2000 to present. Locations missing two or more consecutive months of ZHVI data were excluded from the analysis. For metros missing single months of data, missing values were imputed using an average of the ZHVI for the months immediately before and after.
To improve relevance, metros were grouped into the following cohorts based on population size:
- Small metros: less than 350,000
- Midsize metros: 350,000–999,999
- Large metros: more than 1,000,000
For complete results, see The Most Stable U.S. Housing Markets on Construction Coverage.