Over the past several decades, the health of the average American has steadily declined, marked by rising rates of obesity, diabetes, and other chronic conditions. Since the 1960s, obesity rates have tripled, with over 40% of U.S. adults classified as obese, and diabetes has surged from less than 3% of the adult population in 1980 to more than 11% today.
These are not merely individual challenges but national ones, placing immense strain on the U.S. healthcare system. Chronic diseases—many of which are tied to poor diet—account for 90% of the nation’s $4.5 trillion in annual healthcare spending. According to the Centers for Disease Control and Prevention (CDC), obesity alone costs the U.S. healthcare system nearly $173 billion a year, while diabetes, heart disease, and stroke costs an estimated $835 billion in medical costs and lost productivity.
The consequences of these health crises are glaring when compared to other wealthy nations. Despite spending more on healthcare per capita than any other country, the U.S. lags behind its peers in life expectancy. According to the Organisation for Economic Co-operation and Development (OECD), the U.S. spends $12,555 per capita annually on healthcare—56% more than the next highest-spending country—but ranks just 34th in life expectancy.
Amidst these alarming statistics, a cultural shift is gaining momentum: the call to “Make America Healthy Again.” Central to this movement is a focus on improving dietary habits, as research increasingly highlights the profound impact of diet on overall health. From reducing sugar, processed foods, and alcohol intake to incorporating more fruits, vegetables, and healthy proteins, Americans are beginning to embrace changes that could reverse decades of poor health outcomes. However, diet and the associated health outcomes vary significantly by region, reflecting broader cultural, economic, and demographic differences across the country.
The Prevalence of Diet-Related Health Conditions by State

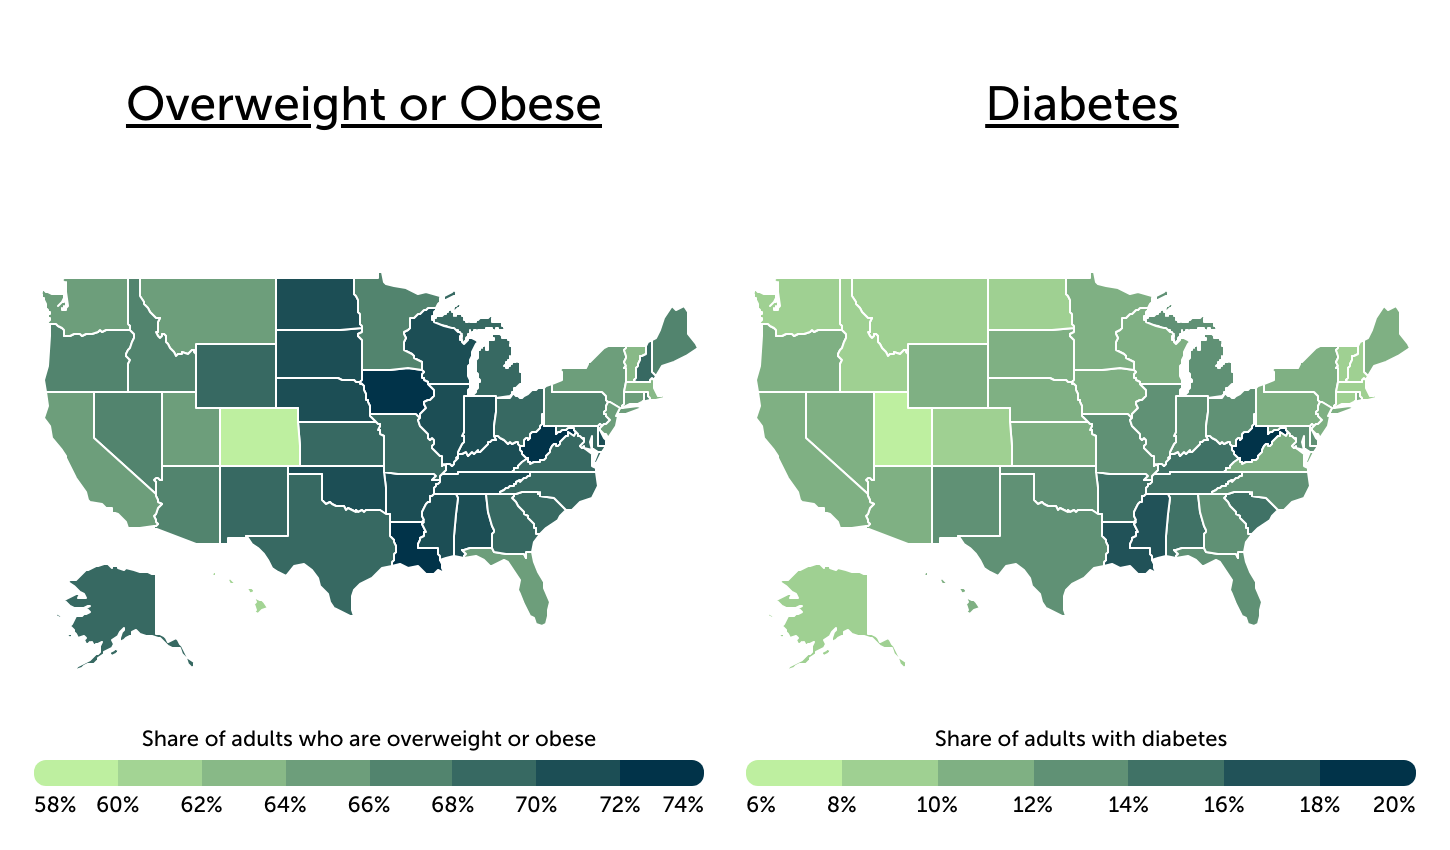
Trace One analysis of CDC data | Image Credit: Trace One
Obesity is a major public health challenge across the U.S., but its impact is most pronounced in Southern and Midwestern states. States like West Virginia (73.2%), Iowa (72.1%), and Louisiana (72.0%) report the highest prevalence of overweight or obese adults. These figures are substantially higher than those observed in states like Colorado (59.8%) and Hawaii (60.5%), which have the lowest rates in the nation.
Similarly, diabetes prevalence, 90–95% of which is type 2 diabetes—a form largely preventable or manageable through lifestyle changes such as healthier diets and increased physical activity—is significantly higher in the South than in other regions. States like West Virginia (18.2%), Mississippi (17.0%), and Louisiana (16.1%) report the nation’s highest overall diabetes rates. In stark contrast, certain Western states such as Utah (7.8%), Colorado (8.6%), and Alaska (8.7%) have prevalence rates that are about half of those observed in the South.
Similar trends are evident for other diet-related chronic conditions, including high cholesterol, hypertension, and cardiovascular disease, where Southern and Midwestern states consistently exceed national averages in prevalence rates. In West Virginia, for instance, the proportion of adults who have experienced either coronary heart disease or a heart attack is approximately 75% higher than the national average.
Food Insecurity and Its Impact on Diet

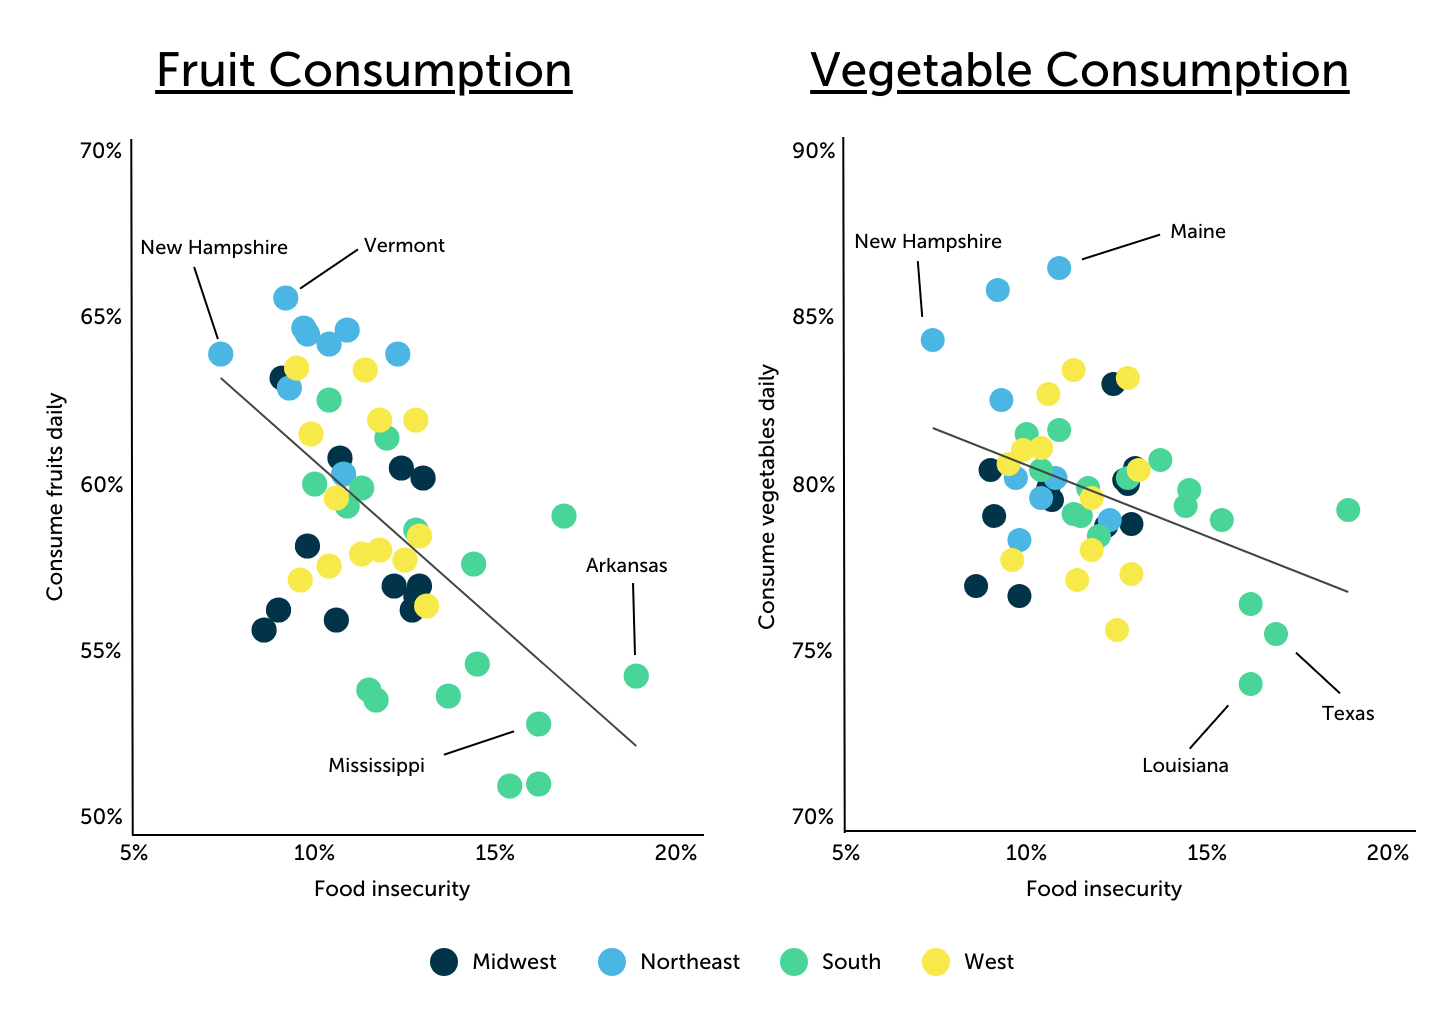
Trace One analysis of CDC data | Image Credit: Trace One
The same regional patterns that define disparities in chronic health conditions also manifest in food access and dietary habits. Southern and Midwestern states, where obesity, diabetes, and cardiovascular disease rates are highest, consistently report lower consumption of fruits and vegetables and higher reliance on sugar-sweetened beverages and other processed foods. These dietary habits are influenced by socioeconomic factors, including food insecurity, which is disproportionately prevalent in these regions and significantly impacts the availability and affordability of nutritious options.
Food insecurity—defined as lacking consistent access to sufficient food—affects 12.2% of U.S. households, according to the U.S. Department of Agriculture (USDA). However, in states like Arkansas (18.9%), Texas (16.9%), Mississippi (16.2%), and Louisiana (16.2%), food insecurity rates far exceed the national average. In these areas, families often turn to cheaper, calorie-dense foods, exacerbating poor dietary habits and limiting the intake of nutrient-rich fruits and vegetables. This dynamic fuels a cycle of poor nutrition, contributing to the region’s elevated rates of diet-related chronic diseases.
In contrast, states with lower levels of food insecurity often report healthier eating patterns. New England states such as Vermont, Maine, and New Hampshire consistently lead in fruit and vegetable consumption, with over 64% of adults consuming fruits daily and over 84% eating vegetables daily. These states also report food insecurity rates well below the national average, reflecting how improved access to affordable, nutritious food supports healthier dietary choices.
States With the Healthiest Diets

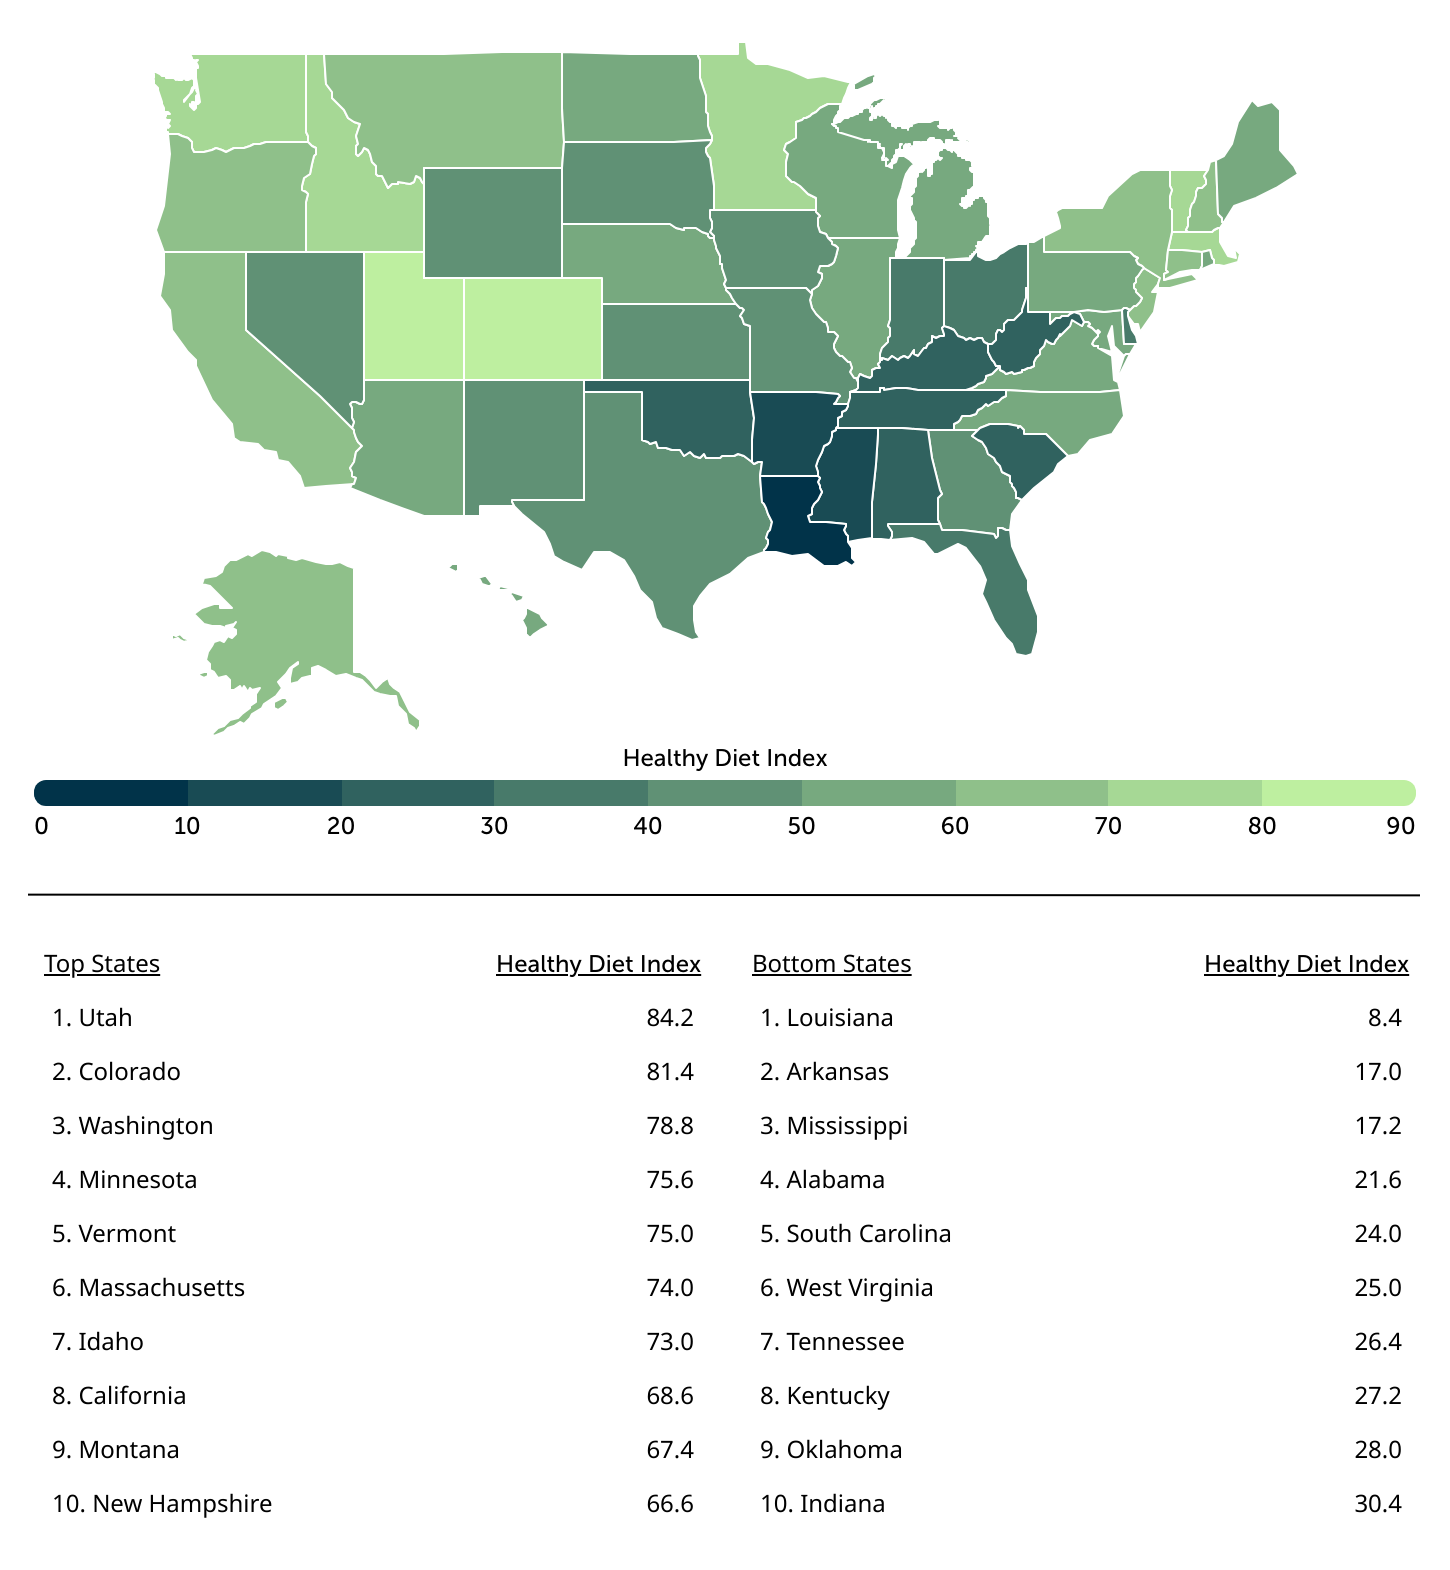
Source: Trace One analysis of CDC and USDA data | Image Credit: Trace One
When considering eating habits, food access, alcohol consumption, and the prevalence of diet-related health conditions, certain states stand out as having the healthiest diets overall.
Leading the nation, Utah achieves its high score due to a combination of strong daily fruit consumption, low rates of alcohol and sugar-sweetened beverage consumption, and the lowest rates of diet-related health conditions in the U.S. Neighboring Colorado ranks second, driven by its distinction as having the lowest rate of overweight or obesity in the country (59.8%), high fruit and vegetable consumption, and low rates of diabetes and other chronic conditions. Additionally, food insecurity in Colorado is among the nation’s lowest, at just 9.9%. Washington, rounding out the top three, performs consistently well across most metrics, including vegetable consumption and low rates of metabolic syndrome, though its slightly higher-than-average alcohol consumption stands out as an area for improvement.
In general, states in the West—particularly the Mountain West—and the Northeast tend to report healthier diets and lower rates of diet-related conditions. Vermont, Massachusetts, and Idaho are other top-ranking states in these regions. In stark contrast, states in the South dominate the bottom of the rankings. Of the 10 states with the least healthy diets, nine are in the South, with Louisiana, Arkansas, and Mississippi occupying the lowest positions.
This analysis was conducted by Trace One—a company specializing in software for the food and beverage industry—using data from the CDC and USDA. For more information and complete results, see the original post: States With the Healthiest Diets.
Methodology

Photo Credit: Inside Creative House / Shutterstock
The data used in this study comes from the U.S. Centers for Disease Control and Prevention’s Behavioral Risk Factor Surveillance System (BRFSS) and National Health Interview Survey, as well as the U.S. Department of Agriculture’s Economic Research Service. To determine the states with the healthiest diets, researchers created a composite Healthy Diet Index based on the following factors, all weighted evenly:
- Share of adults who consume fruits daily (higher is better)
- Share of adults who consume vegetables daily (higher is better)
- Share of adults who either don’t drink alcohol or drink moderately (higher is better)
- Share of adults who drink sugar-sweetened beverages daily (lower is better)
- Share of households facing food insecurity (lower is better)
- Share of adults with overweight or obesity (lower is better)
- Share of adults with a history of diabetes (lower is better)
- Share of adults with a history of high cholesterol (lower is better)
- Share of adults with a history of high blood pressure (lower is better)
- Share of adults with a history of coronary heart disease or heart attack (lower is better)
Due to limitations with the CDC data, not all states report data on each factor every year. Because of this, the latest available data was used for each state. In the event of a tie, the state with the higher percentage of adults who consume fruits daily was ranked higher.
For complete results, see States With the Healthiest Diets on Trace One.
