Photo Credit: Grand Warszawski / Shutterstock
After slowing down in the early days of the COVID-19 pandemic, the U.S. rental housing market has more than rebounded. As the housing market boomed, so did the rental market. Rents have risen sharply as demand has grown and supply remains constrained across much of the country. And even as housing prices have cooled in recent months, rents are still going up.
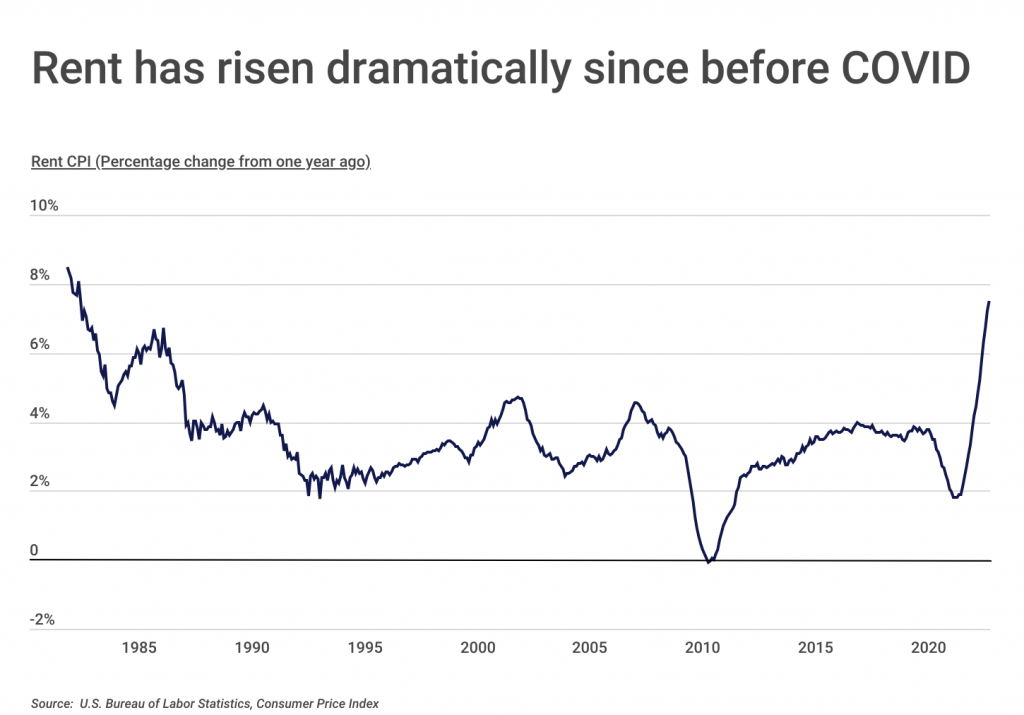
According to Consumer Price Index (CPI) data, U.S. rents have risen at their fastest pace since the 1980s. The rise in rent has been one of the biggest drivers of inflation. In October, the rent index increased by 0.7% over the previous month, and the shelter index—which includes rent—rose by 0.8%, the largest monthly increase since August 1990.
Similar to the housing market, rents are rising due to a combination of limited supply and increased demand. On the supply side, the U.S. has underinvested in housing for the last decade, and pandemic-related worker shortages and supply chain disruptions only made the problem worse. On the demand side, after the early days of the pandemic in which many people moved into temporary living situations (such as moving back in with parents), they then sought to move into their own spaces independently. Census Bureau data shows that the number of households grew by three-quarters of a million from 2020 to 2021. On top of this, people priced out of the housing market forced many would-be buyers to continue renting.
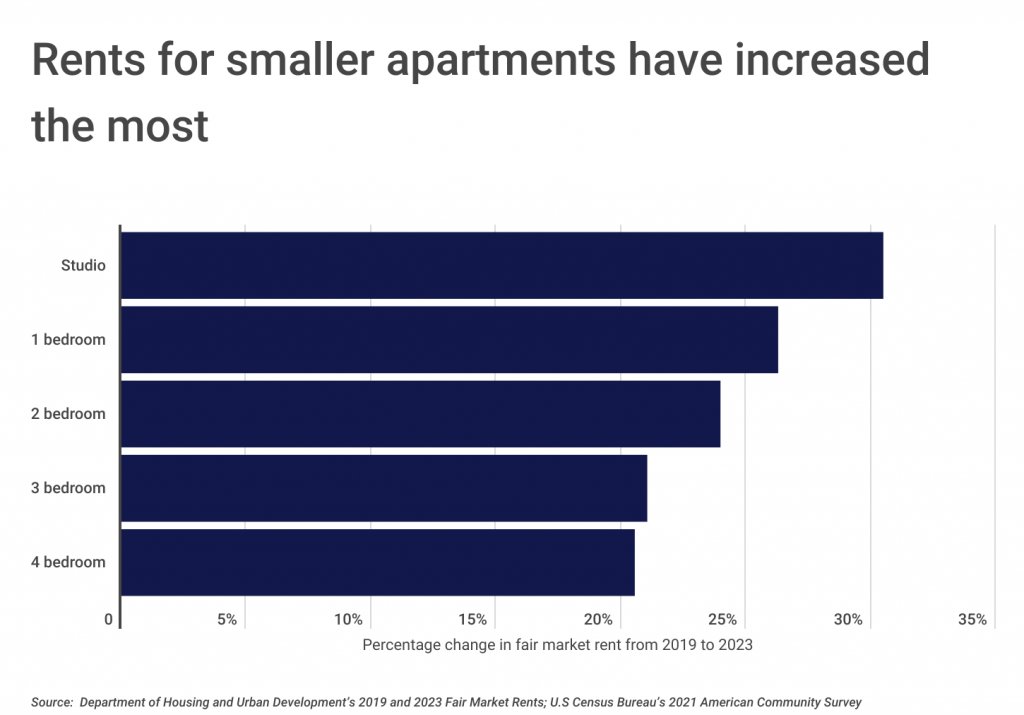
The latest data from the Department of Housing and Urban Development (HUD) shows that fair market rents—estimates of the monthly dollar amount that a rental property is likely to command in a particular location—increased by an average of 24% from 2019 to 2023. Smaller rental units increased by the largest amount, with studios rising by more than 30% and one-bedrooms rising by approximately 26%. Renters looking for smaller, lower-priced options have been disproportionately hurt by increasing rents.
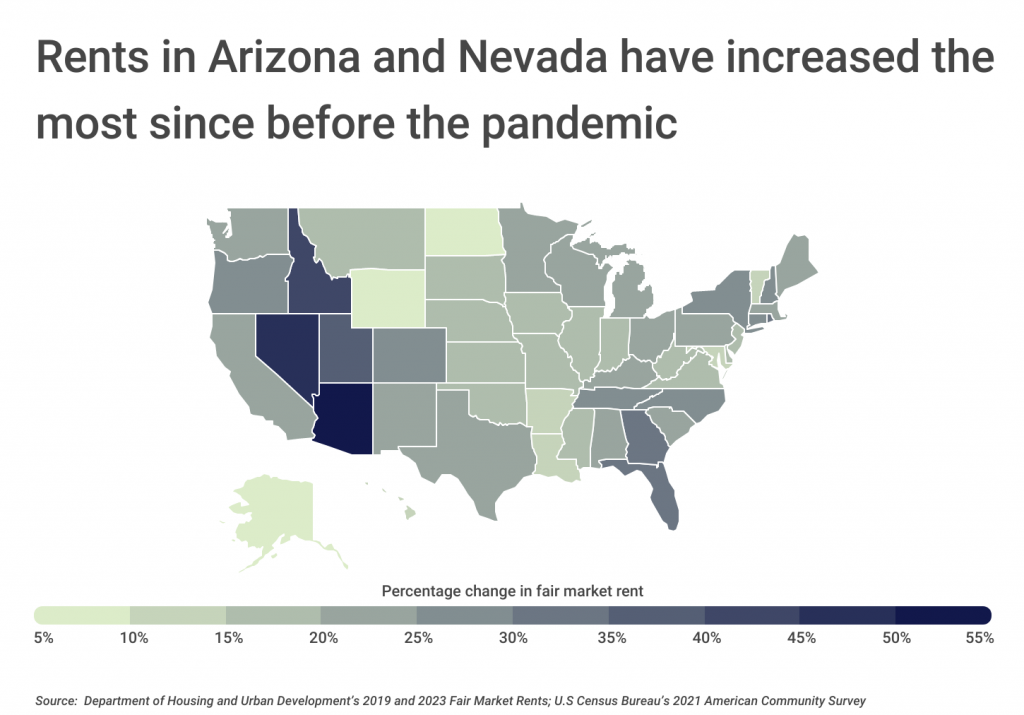
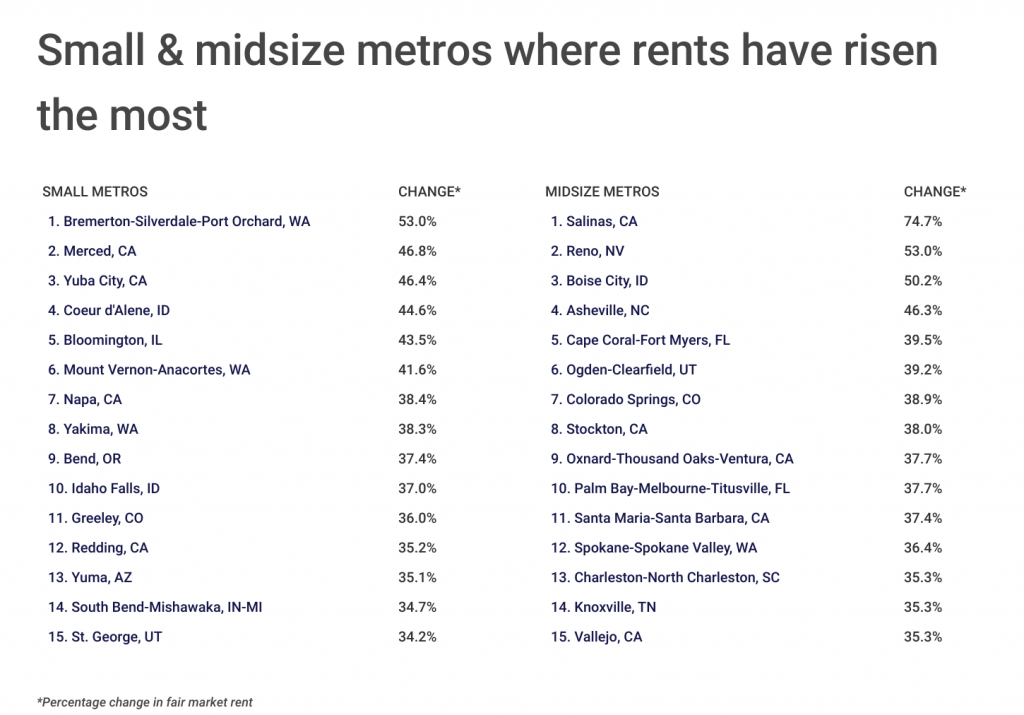
While a nearly 25% average increase at the national level might sound large, some local housing markets have seen rent increases north of 50% when comparing the new HUD data for 2023 with that of 2019. At the state level, renters in Arizona and Nevada have contended with the largest rent increases in the country, at 53.9% and 48.4% respectively. At the opposite end of the spectrum, rents rose only 5% in Alaska since before the pandemic.
To determine the U.S. metropolitan areas with the largest increase in fair market rent since pre-COVID, researchers at Construction Coverage analyzed data from the Department of Housing and Urban Development and the U.S Census Bureau. The researchers ranked metros according to the percentage change in fair market rent from 2019 to 2023. Researchers also calculated the fair market rent for studio, one-bedroom, two-bedroom, three-bedroom, and four-bedroom rentals in 2023.
Here are the metros with the largest increase in fair market rent since pre-COVID.
Large Metros Where Rents Have Risen the Most
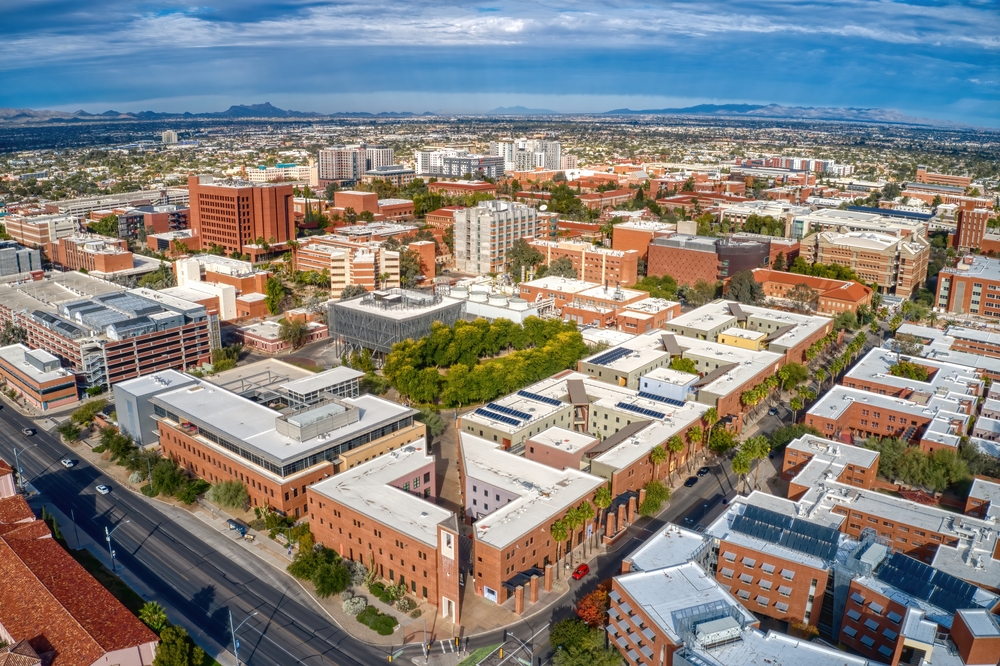
Photo Credit: Jacob Boomsma / Shutterstock
15. Tucson, AZ
- Percentage change in fair market rent: 29.9%
- Studio fair market rent: $786
- 1-br fair market rent: $893
- 2-br fair market rent: $1,175
- 3-br fair market rent: $1,670
- 4-br fair market rent: $1,955
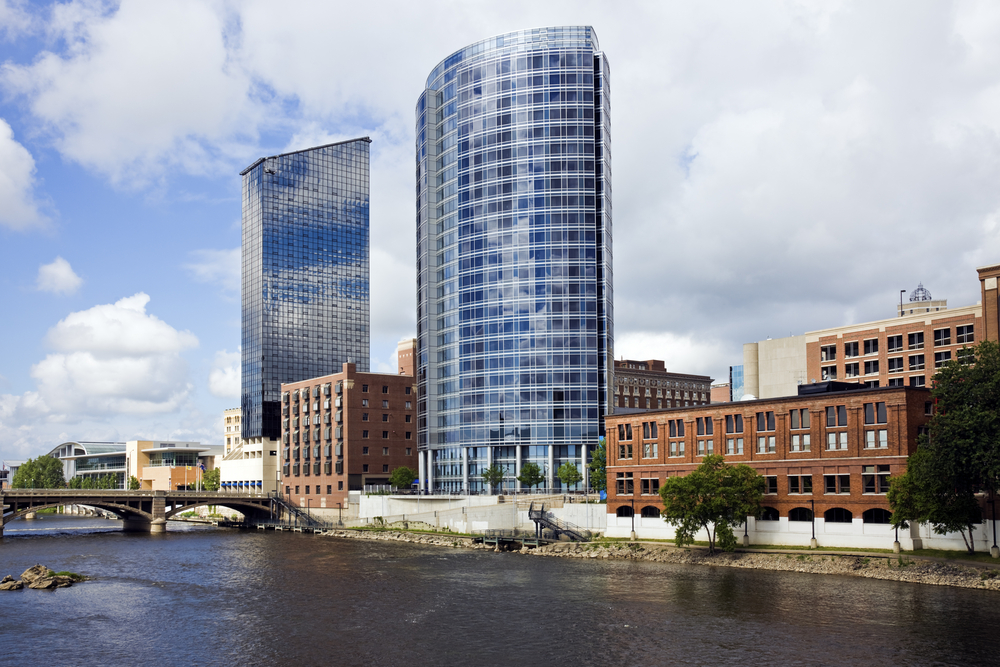
Photo Credit: Henryk Sadura / Shutterstock
14. Grand Rapids-Kentwood, MI
- Percentage change in fair market rent: 31.1%
- Studio fair market rent: $918
- 1-br fair market rent: $966
- 2-br fair market rent: $1,172
- 3-br fair market rent: $1,517
- 4-br fair market rent: $1,708
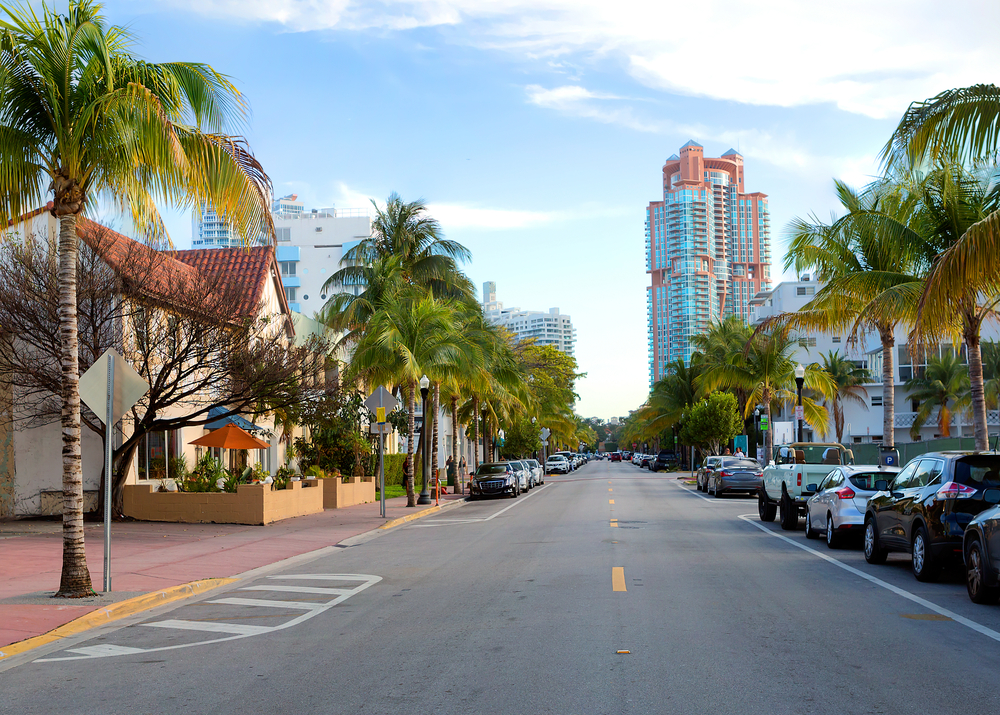
Photo Credit: Galina Savina / Shutterstock
13. Miami-Fort Lauderdale-Pompano Beach, FL
- Percentage change in fair market rent: 31.5%
- Studio fair market rent: $1,338
- 1-br fair market rent: $1,523
- 2-br fair market rent: $1,889
- 3-br fair market rent: $2,542
- 4-br fair market rent: $3,063

Photo Credit: Sean Pavone / Shutterstock
12. Providence-Warwick, RI-MA
- Percentage change in fair market rent: 32.8%
- Studio fair market rent: $1,080
- 1-br fair market rent: $1,188
- 2-br fair market rent: $1,450
- 3-br fair market rent: $1,781
- 4-br fair market rent: $2,160

Photo Credit: stellamc / Shutterstock
11. Fresno, CA
- Percentage change in fair market rent: 33.0%
- Studio fair market rent: $991
- 1-br fair market rent: $997
- 2-br fair market rent: $1,258
- 3-br fair market rent: $1,772
- 4-br fair market rent: $2,029

Photo Credit: D Guest Smith / Shutterstock
10. Dallas-Fort Worth-Arlington, TX
- Percentage change in fair market rent: 33.4%
- Studio fair market rent: $1,205
- 1-br fair market rent: $1,293
- 2-br fair market rent: $1,526
- 3-br fair market rent: $1,953
- 4-br fair market rent: $2,503
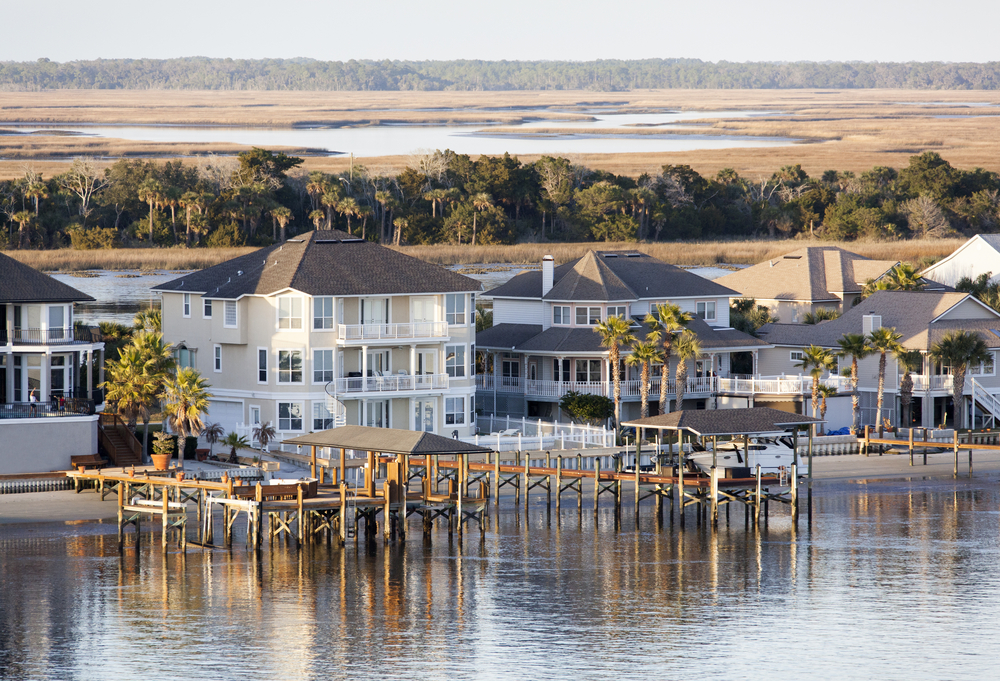
Photo Credit: Ramunas Bruzas / Shutterstock
9. Jacksonville, FL
- Percentage change in fair market rent: 33.8%
- Studio fair market rent: $948
- 1-br fair market rent: $1,094
- 2-br fair market rent: $1,295
- 3-br fair market rent: $1,667
- 4-br fair market rent: $2,111

Photo Credit: Infinity Moments LLC / Shutterstock
8. Orlando-Kissimmee-Sanford, FL
- Percentage change in fair market rent: 35.8%
- Studio fair market rent: $1,338
- 1-br fair market rent: $1,422
- 2-br fair market rent: $1,616
- 3-br fair market rent: $2,064
- 4-br fair market rent: $2,503
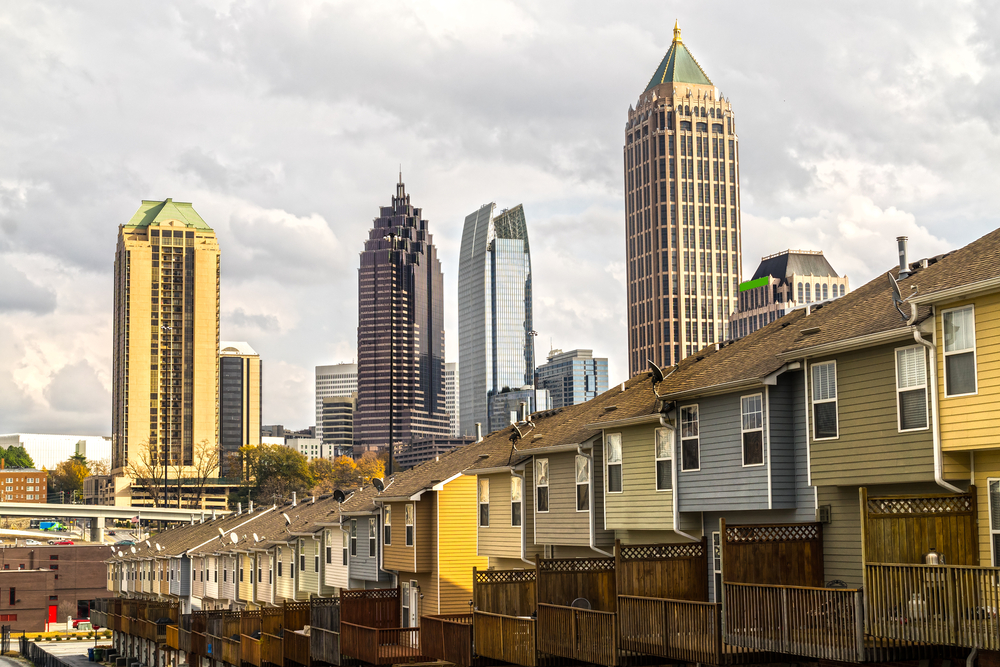
Photo Credit: Luciano Mortula – LGM / Shutterstock
7. Atlanta-Sandy Springs-Alpharetta, GA
- Percentage change in fair market rent: 37.8%
- Studio fair market rent: $1,334
- 1-br fair market rent: $1,363
- 2-br fair market rent: $1,542
- 3-br fair market rent: $1,879
- 4-br fair market rent: $2,293
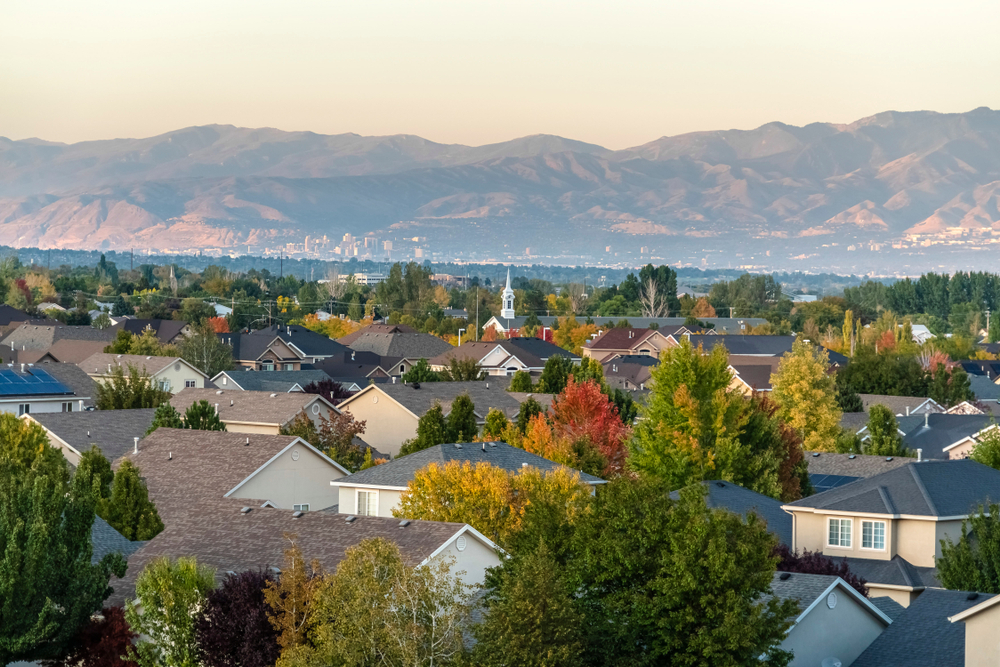
Photo Credit: Jason Finn / Shutterstock
6. Salt Lake City, UT
- Percentage change in fair market rent: 39.3%
- Studio fair market rent: $1,033
- 1-br fair market rent: $1,234
- 2-br fair market rent: $1,482
- 3-br fair market rent: $2,030
- 4-br fair market rent: $2,284
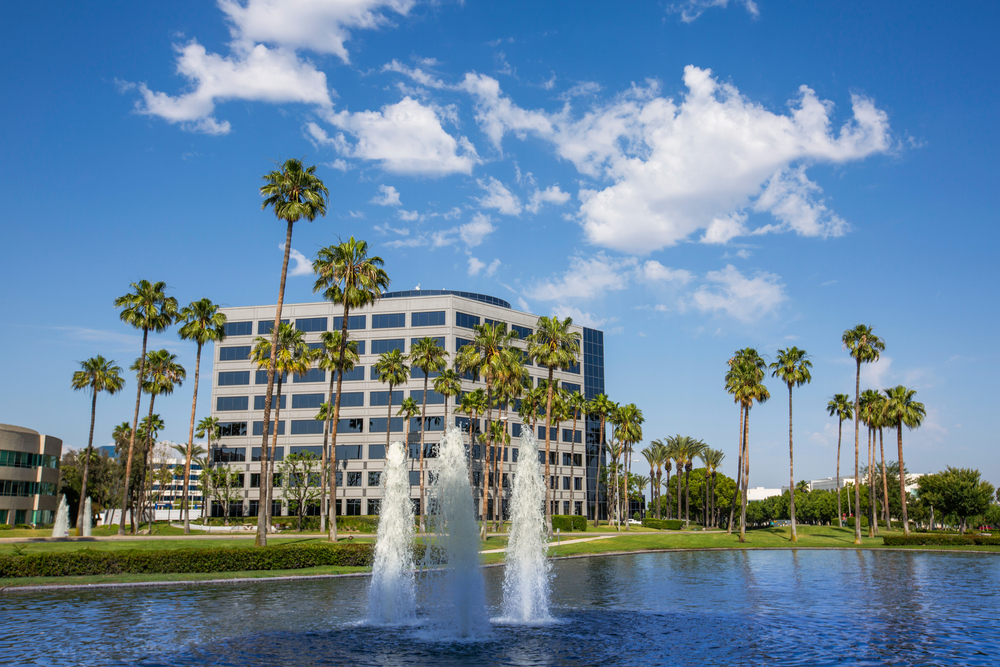
Photo Credit: Matt Gush / Shutterstock
5. Riverside-San Bernardino-Ontario, CA
- Percentage change in fair market rent: 41.1%
- Studio fair market rent: $1,281
- 1-br fair market rent: $1,398
- 2-br fair market rent: $1,751
- 3-br fair market rent: $2,376
- 4-br fair market rent: $2,922

Photo Credit: Andriy Blokhin / Shutterstock
4. Sacramento-Roseville-Folsom, CA
- Percentage change in fair market rent: 42.6%
- Studio fair market rent: $1,287
- 1-br fair market rent: $1,401
- 2-br fair market rent: $1,765
- 3-br fair market rent: $2,502
- 4-br fair market rent: $2,922

Photo Credit: Kevin J King / Shutterstock
3. Tampa-St. Petersburg-Clearwater, FL
- Percentage change in fair market rent: 46.9%
- Studio fair market rent: $1,291
- 1-br fair market rent: $1,381
- 2-br fair market rent: $1,659
- 3-br fair market rent: $2,123
- 4-br fair market rent: $2,603
Photo Credit: trekandshoot / Shutterstock
2. Las Vegas-Henderson-Paradise, NV
- Percentage change in fair market rent: 49.2%
- Studio fair market rent: $1,046
- 1-br fair market rent: $1,212
- 2-br fair market rent: $1,457
- 3-br fair market rent: $2,071
- 4-br fair market rent: $2,464

Photo Credit: Gregory E. Clifford / Shutterstock
1. Phoenix-Mesa-Chandler, AZ
- Percentage change in fair market rent: 62.3%
- Studio fair market rent: $1,344
- 1-br fair market rent: $1,467
- 2-br fair market rent: $1,740
- 3-br fair market rent: $2,386
- 4-br fair market rent: $2,716
Detailed Findings & Methodology
To determine the U.S. metropolitan areas with the largest increase in fair market rent since pre-COVID, researchers at Construction Coverage analyzed data from the Department of Housing and Urban Development’s 2019 and 2023 Fair Market Rents and the U.S Census Bureau’s 2021 American Community Survey. The researchers ranked metros according to the percentage change in fair market rent from 2019 to 2023, calculated as the weighted average of the percentage change in rent for a studio, one-bedroom, two-bedroom, three-bedroom, and four-bedroom apartment, with the number of units of each type of apartment serving as weights. In the event of a tie, the metro with the larger (unweighted) average percentage change in rent was ranked higher.
To improve relevance, only metropolitan areas with at least 100,000 people were included in the analysis. Additionally, metro areas were grouped into the following cohorts based on population size:
- Small metros: 100,000–349,999
- Midsize metros: 350,000–999,999
- Large metros: more than 1,000,000