
Photo Credit: Iryna Kalamurza / Shutterstock
Recent years have brought explosive demand for products and resources to improve people’s health and well-being. The wellness market is one of the fastest-growing consumer industries, as more people seek out new products and services to support wellness, from fitness to nutrition to mindfulness and mental health.
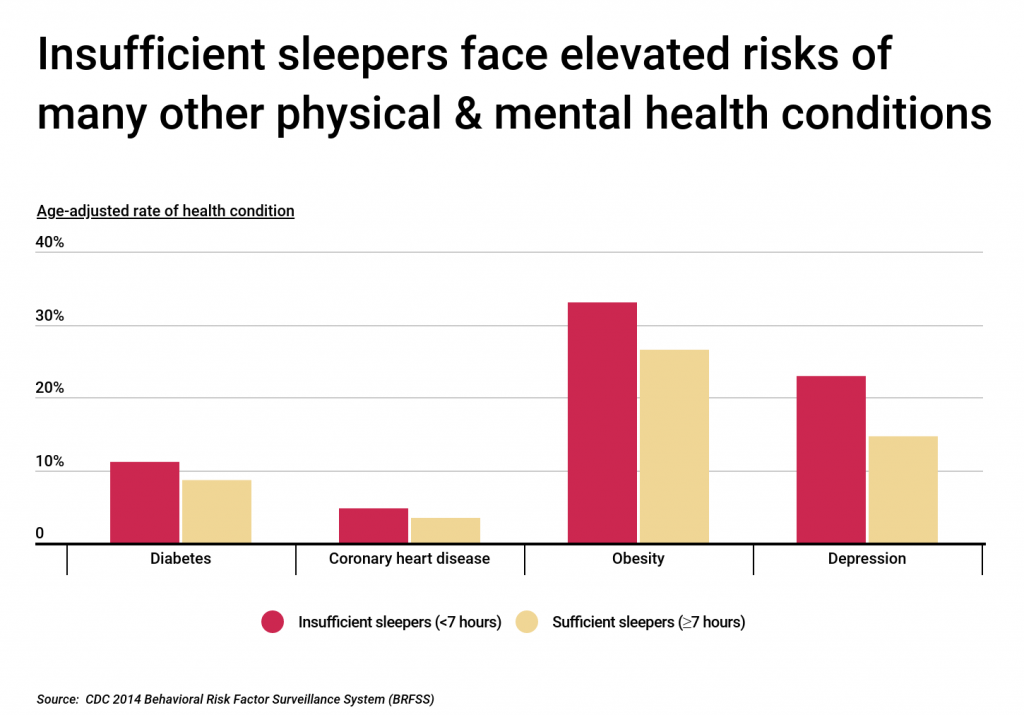
But one of the most important components of health and wellness is also one of the most fundamental: sleep. Lower rates of sleep are associated with a number of health problems, including a weakened immune system, reduced memory and cognitive performance, and greater likelihood of injuries or accidents. The CDC recommends that all adults get more than seven hours of sleep per night to help ensure good health, though only around two in three adults report meeting that threshold.
Critically, people who get less sleep tend to have more difficulty preventing and managing chronic health conditions. People who sleep less than seven hours are significantly more likely than those sleeping more than seven hours to have diabetes (11.1% vs. 8.6%), coronary heart disease (4.7% vs. 3.4%), and obesity (33.0% vs. 26.5%). And mental health shows the relationship even more strongly: the rate of depression among insufficient sleepers is more than 1.5 times as high as the rate for sufficient sleepers (22.9% vs. 14.6%).
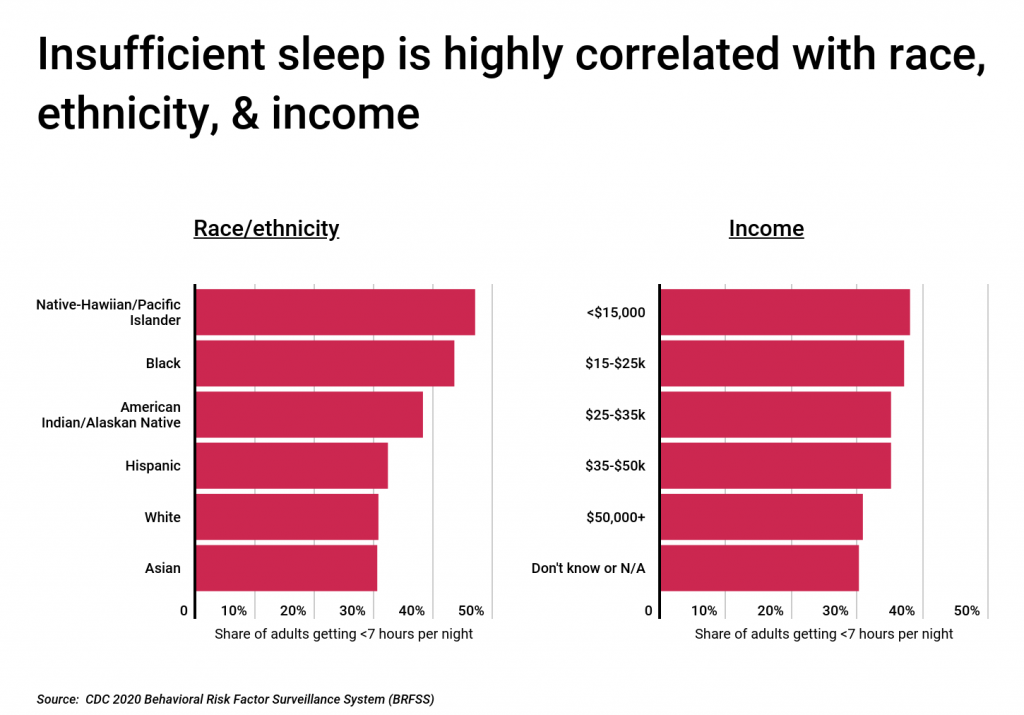
And as with other health behaviors and conditions, quality sleep is uneven across different demographic categories. Around one-third of all adults get less than seven hours of sleep per night, but that figure varies according to factors like race and ethnicity and income level. Nearly half of Native Hawaiians and Pacific Islanders (47.0%) are not getting enough sleep, along with more than two in five Black Americans (43.5%)—far higher than the rates for Asian (30.5%), White (30.7%), and Hispanic (32.3%) Americans. For the lowest income Americans—those making less than $15,000 per year—38% are sleeping less than seven hours on average, but for those on the higher end of the income spectrum making more than $50,000, only 30.8% are sleep-deprived.
These demographic characteristics also help explain the locations where people are getting the least sleep. Hawaii (44%) has the most residents receiving inadequate sleep, which makes sense given the high population of Native Hawaiians and Pacific Islanders. Many of the other states with residents sleeping less are found in the Appalachian region—including West Virginia (41.5%), Kentucky (40.7%), and Tennessee (40.7%)—which has some of the lowest incomes of any part of the country. At the local level, the majority of the most sleep-deprived cities are found in these states and in nearby parts of the South and Rust Belt regions.

The data used in this analysis is from the CDC’s PLACES: Local Data for Better Health 2021 Release. To determine the most sleep-deprived locations in the U.S., researchers at HotDog.com calculated the proportion of adults who get less than the recommended minimum of seven hours of sleep in a typical 24 hour period. For additional context, researchers also calculated the proportion of adults who report various health conditions associated with insufficient sleep, including diabetes, coronary heart disease, obesity, and depression.
Here are the most sleep-deprived cities in the U.S.
Cities Whose Residents Don’t Get Enough Sleep

Photo Credit: Zack Frank / Shutterstock
25. Columbus, OH
- Share of adults getting <7 hours per night: 42.2%
- Share of adults with diabetes: 10.4%
- Share of adults with heart disease: 5.3%
- Share of adults with obesity: 36.7%
- Share of adults with depression: 21.9%

Photo Credit: J. Adam Hamilton / Shutterstock
24. Murfreesboro, TN
- Share of adults getting <7 hours per night: 42.3%
- Share of adults with diabetes: 8.9%
- Share of adults with heart disease: 4.5%
- Share of adults with obesity: 36.1%
- Share of adults with depression: 27.8%

Photo Credit: refrina / Shutterstock
23. Fayetteville, NC
- Share of adults getting <7 hours per night: 42.3%
- Share of adults with diabetes: 11.8%
- Share of adults with heart disease: 5.5%
- Share of adults with obesity: 34.3%
- Share of adults with depression: 22.6%

Photo Credit: Sean Pavone / Shutterstock
22. Montgomery, AL
- Share of adults getting <7 hours per night: 42.6%
- Share of adults with diabetes: 14.2%
- Share of adults with heart disease: 6.5%
- Share of adults with obesity: 37.6%
- Share of adults with depression: 22.0%

Photo Credit: Sergey Novikov / Shutterstock
21. Buffalo, NY
- Share of adults getting <7 hours per night: 42.7%
- Share of adults with diabetes: 13.1%
- Share of adults with heart disease: 6.6%
- Share of adults with obesity: 37.2%
- Share of adults with depression: 21.4%

Photo Credit: Silvio Ligutti / Shutterstock
20. Beaumont, TX
- Share of adults getting <7 hours per night: 42.8%
- Share of adults with diabetes: 14.1%
- Share of adults with heart disease: 6.3%
- Share of adults with obesity: 41.0%
- Share of adults with depression: 19.7%

Photo Credit: Sean Pavone / Shutterstock
19. Augusta, GA
- Share of adults getting <7 hours per night: 42.8%
- Share of adults with diabetes: 14.4%
- Share of adults with heart disease: 6.7%
- Share of adults with obesity: 37.8%
- Share of adults with depression: 19.8%

Photo Credit: Sean Pavone / Shutterstock
18. Macon, GA
- Share of adults getting <7 hours per night: 43.1%
- Share of adults with diabetes: 15.2%
- Share of adults with heart disease: 7.3%
- Share of adults with obesity: 38.4%
- Share of adults with depression: 21.3%

Photo Credit: beredesign / Shutterstock
17. Newport News, VA
- Share of adults getting <7 hours per night: 43.3%
- Share of adults with diabetes: 11.4%
- Share of adults with heart disease: 5.3%
- Share of adults with obesity: 38.3%
- Share of adults with depression: 19.8%

Photo Credit: Michael Shake / Shutterstock
16. Toledo, OH
- Share of adults getting <7 hours per night: 43.5%
- Share of adults with diabetes: 14.2%
- Share of adults with heart disease: 7.7%
- Share of adults with obesity: 39.5%
- Share of adults with depression: 24.4%

Photo Credit: Sean Pavone / Shutterstock
15. Jackson, MS
- Share of adults getting <7 hours per night: 43.5%
- Share of adults with diabetes: 15.4%
- Share of adults with heart disease: 6.0%
- Share of adults with obesity: 43.4%
- Share of adults with depression: 20.1%

Photo Credit: Felix Mizioznikov / Shutterstock
14. Miramar, FL
- Share of adults getting <7 hours per night: 43.7%
- Share of adults with diabetes: 11.1%
- Share of adults with heart disease: 4.0%
- Share of adults with obesity: 32.2%
- Share of adults with depression: 16.0%

Photo Credit: Wirestock Creators / Shutterstock
13. Rochester, NY
- Share of adults getting <7 hours per night: 43.9%
- Share of adults with diabetes: 12.8%
- Share of adults with heart disease: 6.1%
- Share of adults with obesity: 37.8%
- Share of adults with depression: 22.1%

Photo Credit: SannaBlue / Shutterstock
12. Clarksville, TN
- Share of adults getting <7 hours per night: 44.0%
- Share of adults with diabetes: 10.1%
- Share of adults with heart disease: 4.6%
- Share of adults with obesity: 37.2%
- Share of adults with depression: 25.5%

Photo Credit: Sean Pavone / Shutterstock
11. Birmingham, AL
- Share of adults getting <7 hours per night: 44.0%
- Share of adults with diabetes: 17.3%
- Share of adults with heart disease: 7.2%
- Share of adults with obesity: 39.6%
- Share of adults with depression: 21.0%

Photo Credit: Sean Pavone / Shutterstock
10. Baltimore, MD
- Share of adults getting <7 hours per night: 44.1%
- Share of adults with diabetes: 12.9%
- Share of adults with heart disease: 5.7%
- Share of adults with obesity: 37.2%
- Share of adults with depression: 20.4%

Photo Credit: Sean Pavone / Shutterstock
9. Columbus, GA
- Share of adults getting <7 hours per night: 44.1%
- Share of adults with diabetes: 13.7%
- Share of adults with heart disease: 6.4%
- Share of adults with obesity: 37.5%
- Share of adults with depression: 20.4%

Photo Credit: Gang Liu / Shutterstock
8. Philadelphia, PA
- Share of adults getting <7 hours per night: 45.1%
- Share of adults with diabetes: 12.6%
- Share of adults with heart disease: 6.0%
- Share of adults with obesity: 32.2%
- Share of adults with depression: 22.0%

Photo Credit: Patricia Elaine Thomas / Shutterstock
7. Dayton, OH
- Share of adults getting <7 hours per night: 45.7%
- Share of adults with diabetes: 16.5%
- Share of adults with heart disease: 8.0%
- Share of adults with obesity: 42.2%
- Share of adults with depression: 23.1%

Photo Credit: Izabela23 / Shutterstock
6. Honolulu, HI
- Share of adults getting <7 hours per night: 46.3%
- Share of adults with diabetes: 11.1%
- Share of adults with heart disease: 5.0%
- Share of adults with obesity: 22.4%
- Share of adults with depression: 12.7%

Photo Credit: Mia2you / Shutterstock
5. Miami Gardens, FL
- Share of adults getting <7 hours per night: 46.5%
- Share of adults with diabetes: 16.2%
- Share of adults with heart disease: 6.2%
- Share of adults with obesity: 35.5%
- Share of adults with depression: 17.2%

Photo Credit: Jacob Boomsma / Shutterstock
4. Flint, MI
- Share of adults getting <7 hours per night: 47.6%
- Share of adults with diabetes: 17.9%
- Share of adults with heart disease: 8.3%
- Share of adults with obesity: 49.0%
- Share of adults with depression: 23.8%

Photo Credit: Sean Pavone / Shutterstock
3. Memphis, TN
- Share of adults getting <7 hours per night: 47.9%
- Share of adults with diabetes: 15.7%
- Share of adults with heart disease: 6.6%
- Share of adults with obesity: 40.3%
- Share of adults with depression: 22.2%

Photo Credit: Sean Pavone / Shutterstock
2. Cleveland, OH
- Share of adults getting <7 hours per night: 50.2%
- Share of adults with diabetes: 16.6%
- Share of adults with heart disease: 8.3%
- Share of adults with obesity: 43.9%
- Share of adults with depression: 22.2%

Photo Credit: Sean Pavone / Shutterstock
1. Detroit, MI
- Share of adults getting <7 hours per night: 51.2%
- Share of adults with diabetes: 18.0%
- Share of adults with heart disease: 8.2%
- Share of adults with obesity: 49.0%
- Share of adults with depression: 19.6%
Methodology & Detailed Findings
The data used in this analysis is from the CDC’s PLACES: Local Data for Better Health 2021 Release. To determine the most sleep-deprived locations in the U.S., researchers calculated the proportion of adults who get less than the recommended minimum of seven hours of sleep in a typical 24 hour period. For additional context, researchers also calculated the proportion of adults who report various health conditions associated with insufficient sleep, including diabetes, coronary heart disease, obesity, and depression. Due to data availability limitations, all rates shown are crude (non age-adjusted) rates. Only cities with at least 100,000 residents were included in the analysis, and some cities and states with unavailable data from the CDC were excluded.